October 27th, 2020
Author: Brett Wallace
In modern society, selling our labor power for a living wage is the dominant form of subsistence. The state of employment is a crucial part of our economy and society, impacting our working lives and economic provisions. For decades, the consistent use of key economic indicators, such as Productivity and Costs, Real Earnings, and the Unemployment rate, have measured the health of the economy. These major economic indicators are also the basis of information from which key economic policy decisions and where resources are directed.
The Rate of Unemployment
The U.S. Bureau of Labor Statistics (BLS) reports on the official rate of unemployment, commonly known as U-3, by measuring the number of unemployed people as a percentage of the labor force (The sum of the employed and the unemployed). This rate measures those workers without jobs who are in the labor force. To be counted in the labor force, workers must have looked for work in the last four weeks. The BLS has measured the rate of unemployment this way since 1940.
In September 2020, the official unemployment rate (known as U-3) from the Bureau of Labor Statistics was 7.9%.
The simple formula is this – if you have 10 people unemployed out of a total labor force of 100, you have an unemployment rate of 10%.
- 8 unemployed workers / 100 workers in total labor force = .08
- multiply by 100 = 8%
- unemployment rate = 8%.
Here is the Bureau of Labor Statistics calculation of the official unemployment rate (U-3) for September 2020.
- 12.580 million unemployed workers / 160.143 million in the labor force = 7.9% unemployment rate.
This rate does not count the 6.3 million part-time workers or the 1.922 million workers marginally attached to the labor force. Doing so would bring the total of unemployed workers to 20.802 million and the unemployment rate to 12.8%. This formula is referred to as U-6.
While these measurements are technically accurate, they underreport the number of unemployed workers from a living wage and employment perspective. This paints a misleading that the economy is thriving when it is clearly not.
The BLS rate of unemployment (U-3) counts workers who technically have a job but earn poverty-like wages (below $20,000 a year).
And the rate does not count workers who have stopped looking for work, whether that’s due to a lack of available jobs, depression, or some other reason.
The Bureau of Labor Statistics (BLS) reported unemployment (U-3) was 3.6% in January 2020, rose sharply to 14.7% in April, and has since decreased to 7.9% in September. An official unemployment rate (U-3) of 3.6% in January 2020 gives the impression that the country was at nearly full employment!
It is as though, as we entered a devastating pandemic, almost everyone in the labor force was actually working full-time jobs with decent living wages, and new job creation or wage growth was not urgent.
These rates massively undercount true unemployment, mask the real economic well being of millions of workers, and obscure the disproportionate impact that Black, Hispanic, and woman workers face.
We need a clearer picture of economic health to properly formulate and/or reshape policy and direct resources to the areas of most need.
The Distorted Employment Situation
Despite the reality distortion of these estimates, it does not take rocket science to look around and get a feel for the real state of the economy. Working-class families are struggling to make ends meet. Layoffs have impacted nearly every sector. Politicians proclaim how they will bring good-paying jobs back and, at the same time, present to us how the economy is thriving. Billionaires are propped up in the media for their accumulation of wealth and/or the altruism they promote, while social services budgets are slashed. Everyone knows a post-industrial rural area or a part of a major city that has been economically devastated in the last decade and shows little signs of recovery.
The U.S. Labor Bureau
Why is there such a gap between this rate of unemployment and the social reality we live in? As mentioned, The U.S. Bureau of Labor does not count functionally unemployed workers who technically have a job but earn poverty-like wages (below $20,000 a year) and/or work a reduced workweek that they do not want.
Each month, since 1940, the Bureau of Labor Statistics has conducted the Current Population Survey (CPS). This survey measures U.S. labor force statistics from a sample of 60,000 eligible households.
According to the survey, “people with jobs are employed, people who do not have jobs and are looking for jobs are unemployed, and people who meet neither labor market test are not in the labor force.”1
Workers who are employed and unemployed represent the total labor force.
The BLS statistics of people who are employed, unemployed, or not in the labor force indicate the U.S. employment situation, including:
- The total labor force. The sum of the employed and the unemployed.
- The unemployment rate. The number of unemployed people as a percentage of the labor force.
- The labor force participation rate. The number of people in the labor force as a percentage of the civilian non-institutional population 16 years old and over.
- The employment-population ratio. The percentage of the population working (the number of employed as a percentage of the civilian non-institutional population 16 years old and over).
The Employment-Population Ratio
The employment-population ratio (the percentage of the population working) provides another perspective on unemployment. This statistic measures the percentage of U.S. adults aged 16 and over who aren’t working. Unlike the unemployment rate (U-3) which only includes Americans actively looking for work in the last four weeks, the employment-population ratio includes many Americans who aren’t trying to look for work during the pandemic for a variety of reasons, including job availability, discrimination, and depression.
The formula is this – Labor Force Employed / Total Population.
What it does not count is any economic activity that occurs “under the table” and it does not include a living wage boundary line.
So, let’s imagine, a worker with a graduate degree and a history of work experience was laid off from a job making $200,000 per year. Then, let’s say this worker found employment in another industry earning $75,000 per year. The Employment-to-Population Ratio would look the same since that person was employed. But, we all know the financial impact of this example at scale is ravishing the economy.
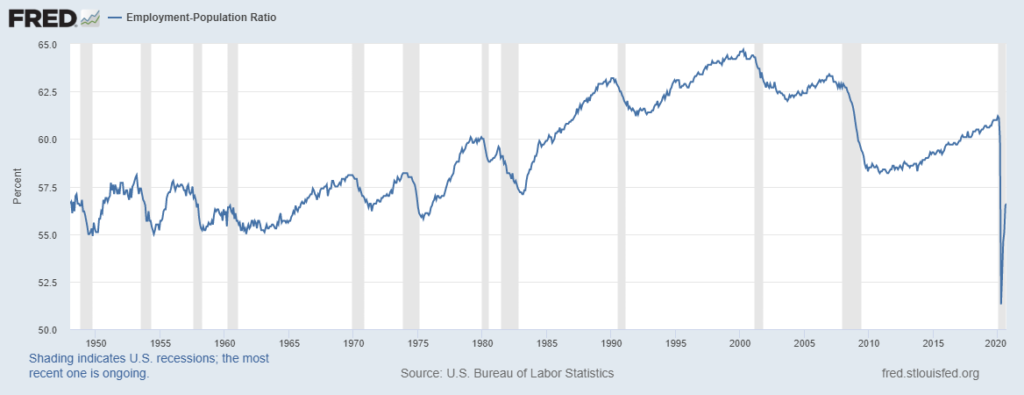
The Federal Reserve Bank of St. Louis estimates from the same Current Population Survey (CPS) only 56.6% of the population that can work is actually working right now. That’s almost half of the U.S. working population (43.4%) not employed at their capacity for work. This statistic is one of the lowest since the bank began collecting data in 1948.2
Functionally unemployed
During Richard Wolff’s weekly economic update, he shared new statistical work that reveals an even closer look at true employment.
This new work is based on the question –
What if you counted everyone as unemployed who is not working, stopped looking for work, not earning above the poverty line, and/or working irregularly with a few hours?
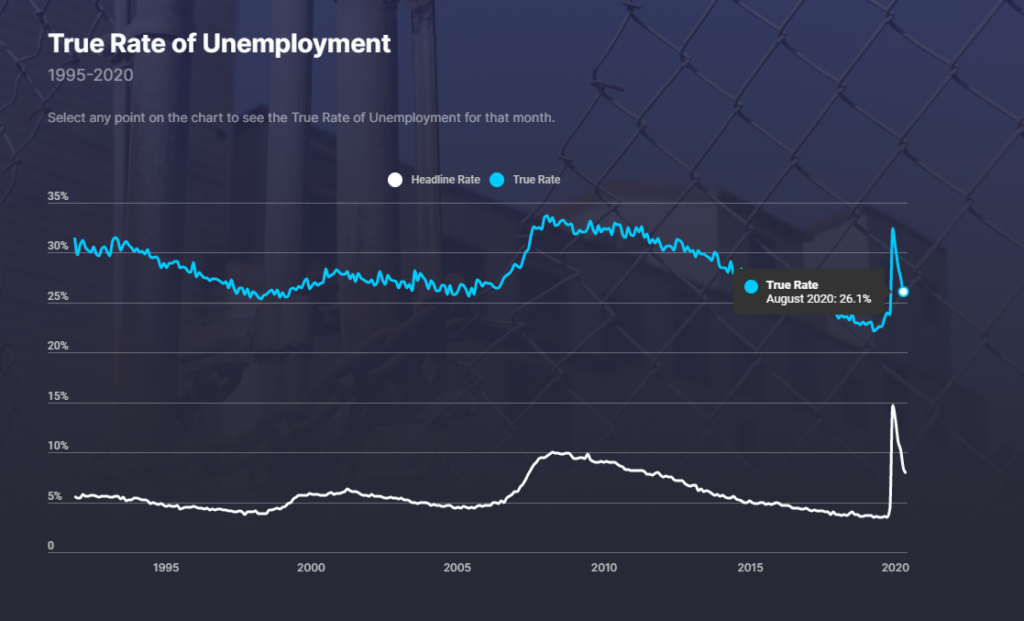
The Ludwig Institute for Shared Economic Prosperity (LISEP) recently revealed such a statistic, the True Rate of Unemployment (TRU). This new statistic uses the Current Population Survey (CPS), to measure the percentage of the U.S. labor force that is functionally unemployed.
LISEP defines functionally unemployed as the percentage of the U.S. labor force that “does not have a full-time job (35+ hours a week) but wants one, has no job, or does not earn a living wage, conservatively pegged at $20,000 annually before taxes.”3
With this new measurement, the unemployment rate of the labor force skyrockets to 26.1 percent for September 2020, compared to the rate of 7.9% by the Bureau of Labor Statistics
This massive increase to 26.1 unemployment is close to The Great Depression where peak unemployment hit 24.9% in 1933.
This new measurement, in contrast to the Bureau of Labor Statistics, takes a living wage into account. The living wage is pegged at $20,000 annually before taxes because the U.S. Department of Health and Human Services (HHS) has determined a three-person earning less than $21,720 is a poverty wage.4

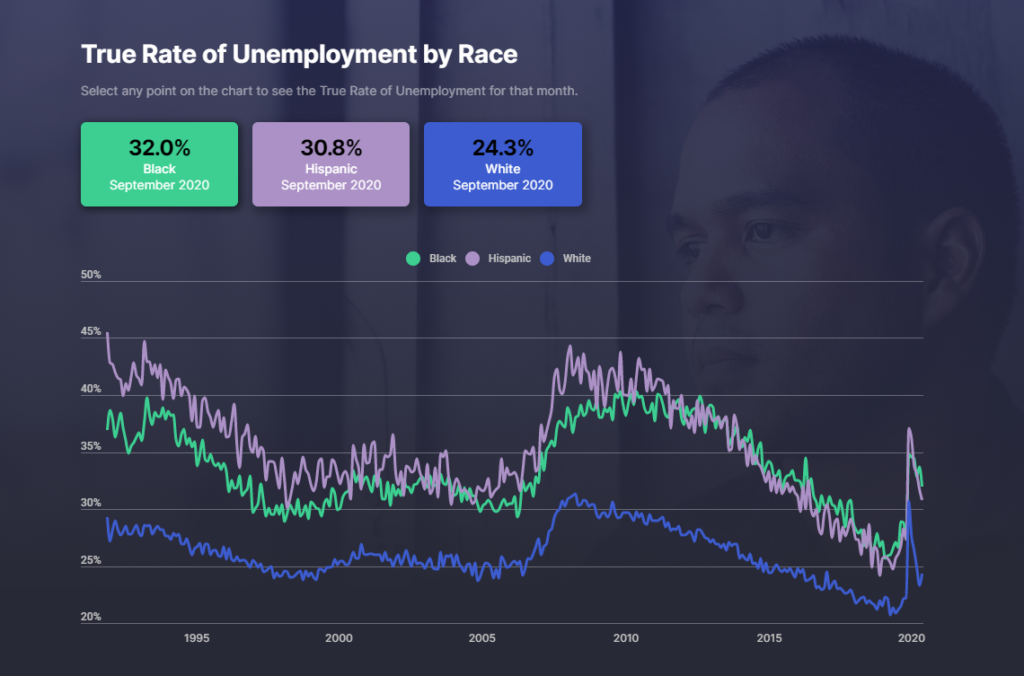
The statistics also show the inequality in the employment situation. Black American workers, who have faced systemic racism for centuries, continue to face greater inequality in employment. The population date (pictured above) showed that 59.2% of Black Americans are unemployed of the U.S. population (age 16 and older) that does not have a full-time job (35+ hours a week), or has a part-time job but wants more hours, and does not earn a living wage, which is conservatively pegged at $20,000 annually before taxes.
The September 2020 unemployment rate for Black Americans in the labor force (pictured below) was 32.0%, compared to 23.3% for White Americans.
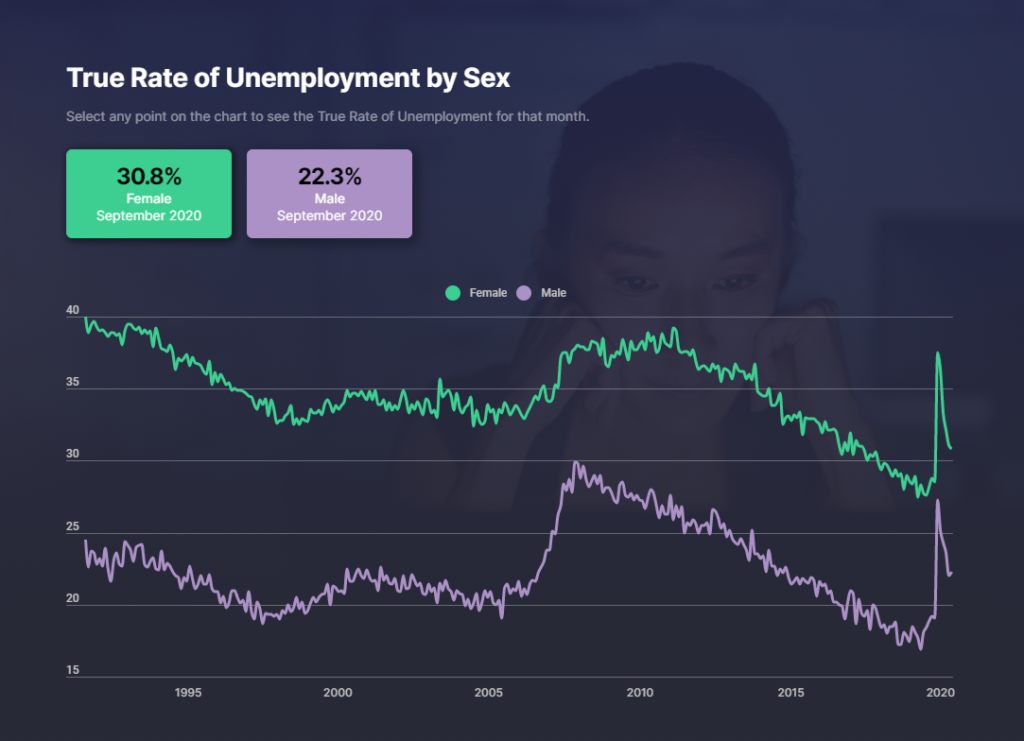
The LISEP report also outlines that in September 2020, the unemployment rate for female workers was 30.8%, compared to 22.3% for male workers (pictured below).
Conclusion
This new statistical work on true employment, based on the percentage of the labor force that does not have a full-time job, has no job, or does not make a living wage, is a much clearer picture of the employment situation that millions of American workers face.
It cuts through the rhetoric of leaders and policymakers using the unemployment rate as a misleading statistic to shout how much the economy is booming. These new numbers incorporating a living wage correspond to the fragile economy of our lived experience, where workers on the lower end of the income spectrum as hurting.
The U.S. Labor Bureau should incorporate this new work to clarify the true employment situation and the need for vital economic resources to be directed to working families and those disproportionately impacted.
- U.S. Bureau of Labor Statistics, “How the Government Measures Unemployment“, accessed via web October 26th, 2020
- U.S. Bureau of Labor Statistics, Employment-Population Ratio [EMRATIO], retrieved from FRED, Federal Reserve Bank of St. Louis; https://fred.stlouisfed.org/series/EMRATIO, October 27, 2020
- The Ludwig Institute for Shared Economic Prosperity (LISEP), Oct. 13, 2020, https://www.lisep.org/, accessed via web October 24th, 2020
- U.S. Department of Health & Human Services, 2020 Poverty Guidelines, January 21, 2020